Machine Learning#
Data Science in Python#
The data cycle#

Last weeks we focused on: preprocessing, visualization & analysis
Today: ML
Machine learning#
We are given a dataset and would like to perform a task with it.
Basic Example - House Price Prediction#
Given: a dataset of N samples \((x_1,y_1),...(x_n,y_n)\)
\(x - square\)
\(y - price\)
Task: what is the price of house that has \(x\) square ?
One dimensional#
import numpy as np
import matplotlib.pyplot as plt
np.random.seed(162)
# Create data
N = 25
x = np.random.rand(N)*100
y = x**2 + np.random.normal(1,2,size=N)*100
colors = (0,0,0)
area = np.pi*3

# Plot
plt.scatter(x, y, s=area, alpha=0.5)
plt.title('House Price Vs Square')
plt.xlabel('Square')
plt.ylabel('Price')
plt.show()
---------------------------------------------------------------------------
ModuleNotFoundError                       Traceback (most recent call last)
Cell In[1], line 2
      1 import numpy as np
----> 2 import matplotlib.pyplot as plt
      3 np.random.seed(162)
      4 # Create data

ModuleNotFoundError: No module named 'matplotlib'
\(x=60\) ?
More Features#
Now what if we know the age of the house ?
\((age,square)\rightarrow price\)
import plotly.express as px

# Create data
np.random.seed(162)
N = 25
x = np.random.rand(N)*100
age = np.random.rand(N)*18
y = x**2 + 0.5*age + np.random.normal(1,2,size=N)*100
colors = (0,0,0)
area = np.pi*3

#Plotting
fig = px.scatter_3d(x=x, y=age, z=y,color=y,labels={'x':'square', 'y':'age', 'z':'price'},width=800, height=500)
fig.update_layout(margin=dict(l=0, r=0, b=0, t=0))
High Dimensional Features#
\(x\in R^d\)

Classical ML#
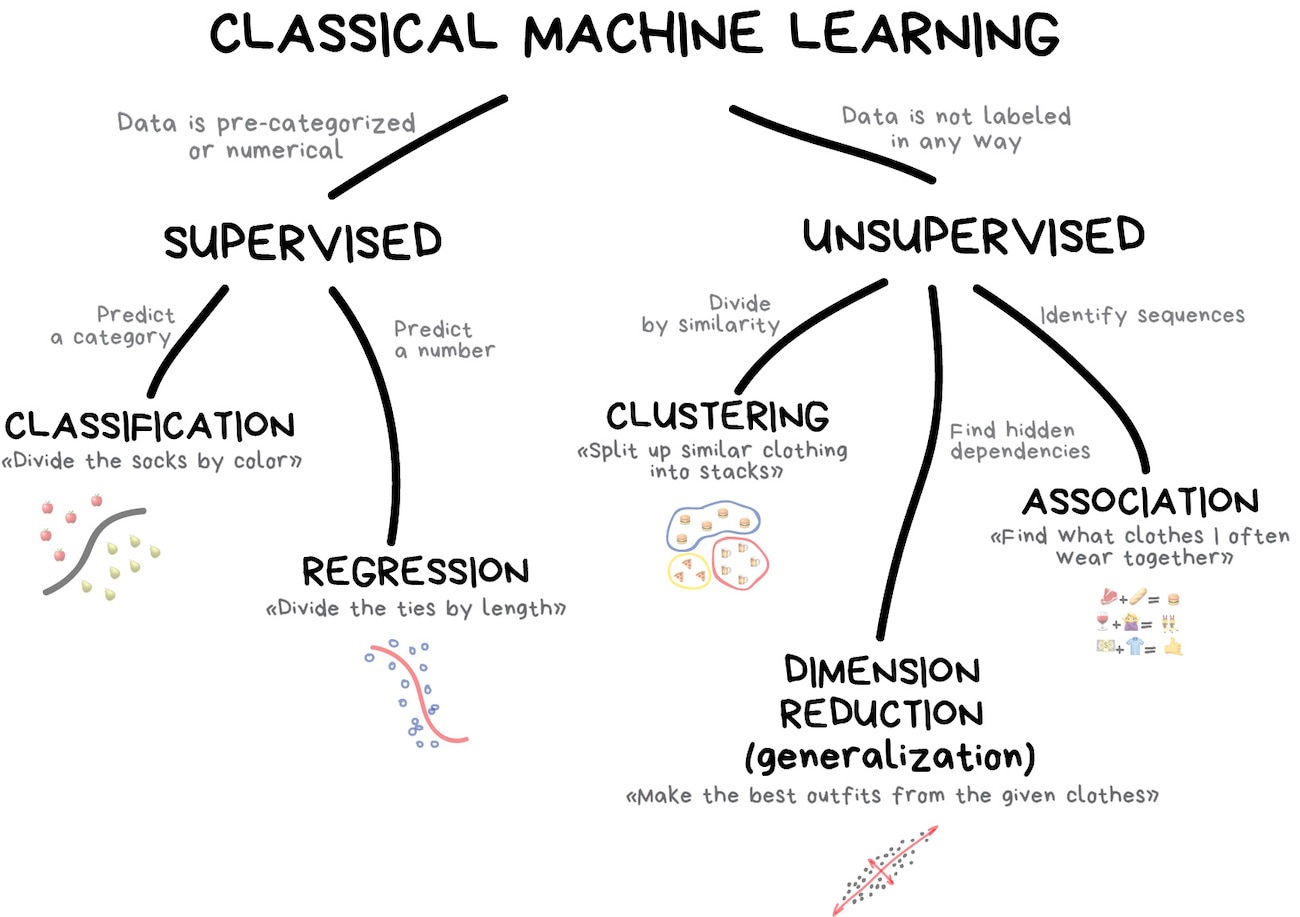
Supervised#
Classification#
Today used for:
Spam filtering
Language detection
Sentiment analysis
Recognition of handwritten characters and numbers
Fraud detection
Popular algorithms: Naive Bayes, Decision Tree, Logistic Regression, K-Nearest Neighbours, Support Vector Machine, DNN (Deep Neural Networks)
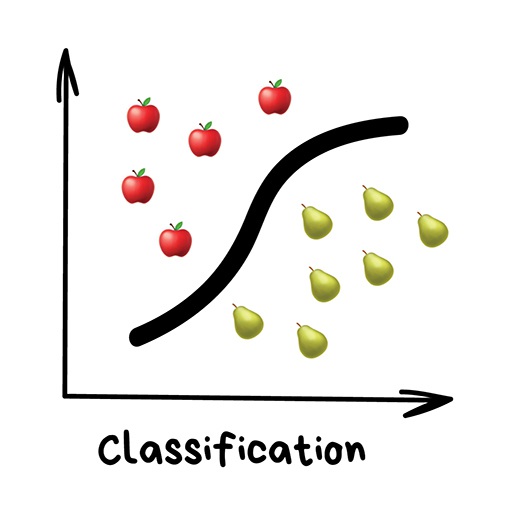
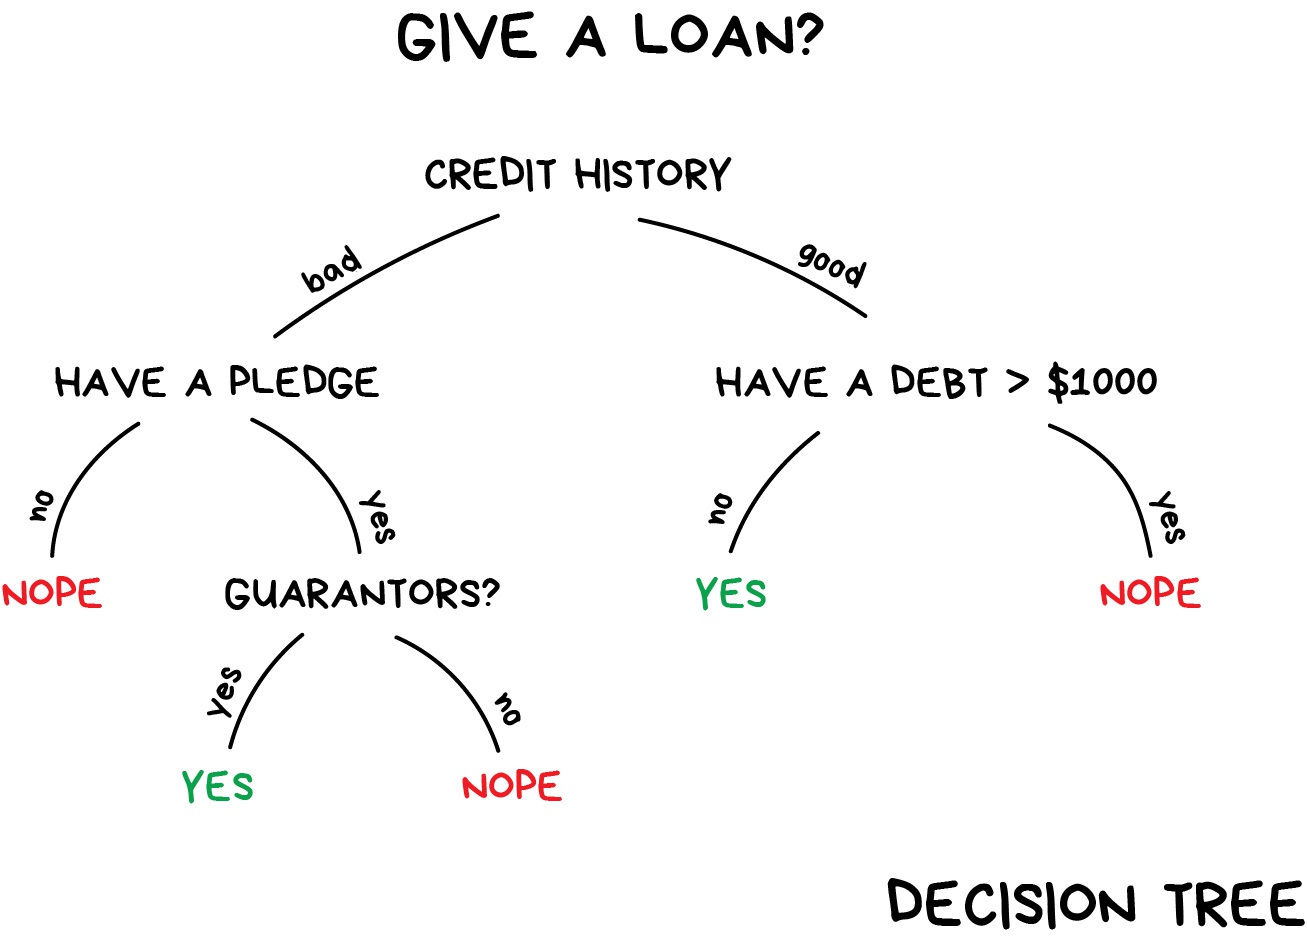
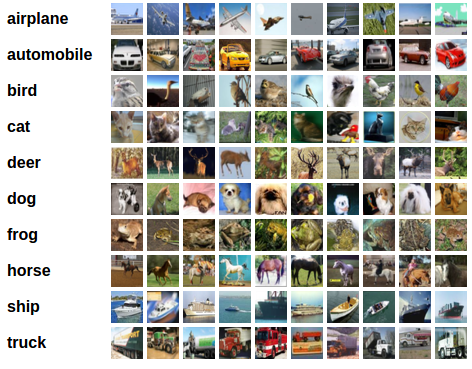
Image Classification (CIFAR10 dataset)
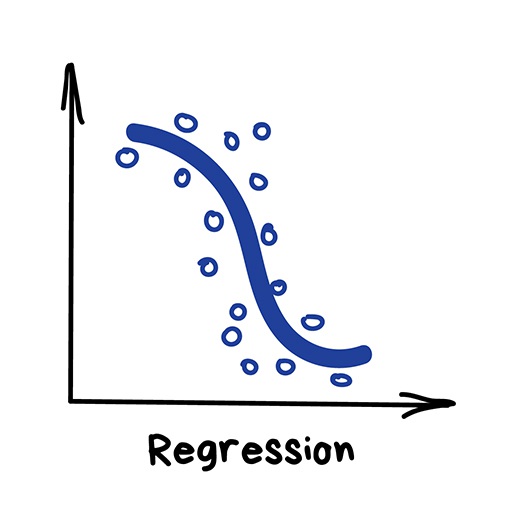
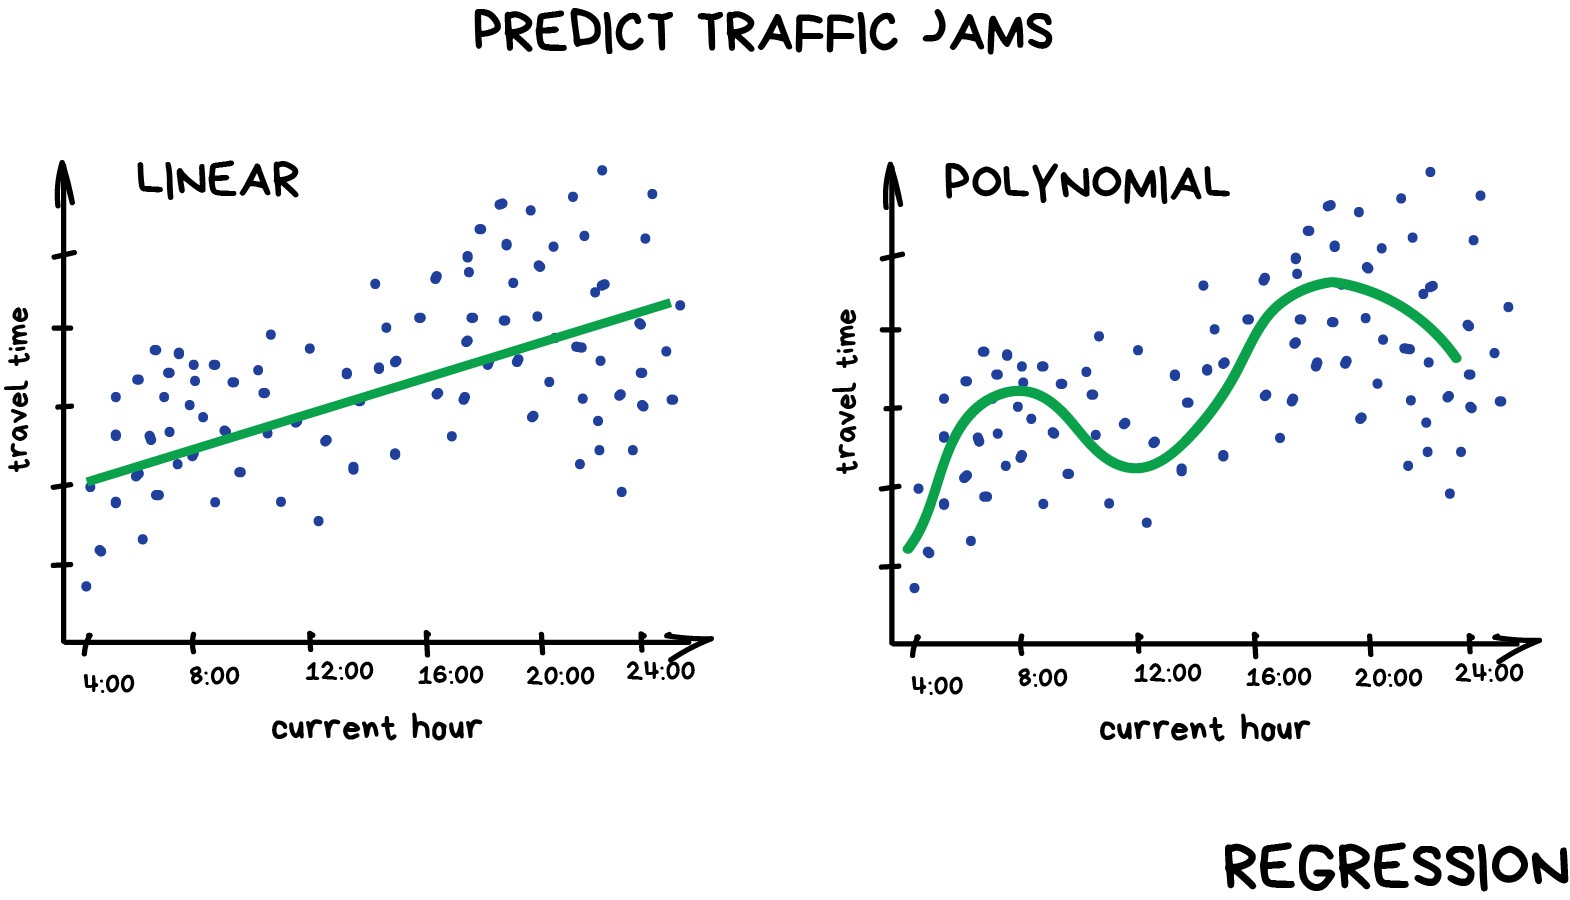
Regression#
Today this is used for:
Stock price forecasts
Demand and sales volume analysis
Medical diagnosis
Any number-time correlations
Unsupervised#
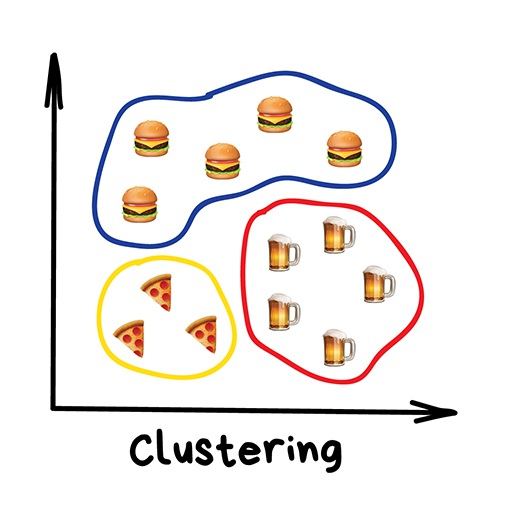
Clustering#
Nowadays used:
For market segmentation (types of customers, loyalty)
To merge close points on a map
To analyze and label new data
To detect abnormal behavior
Dimensionality Reduction#
Used for:
Recommender systems
Beautiful visualizations
Topic modeling and similar document search
Fake image analysis
signal analysis
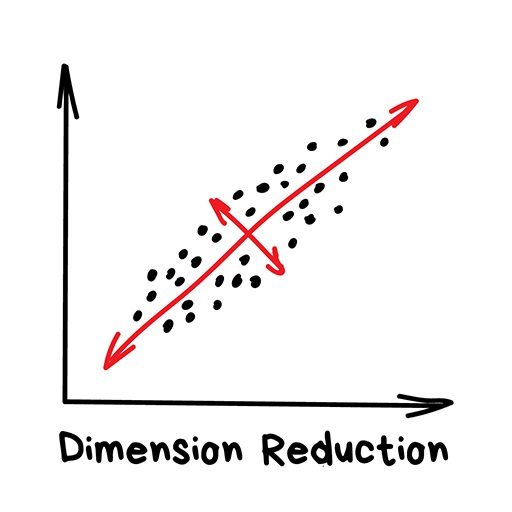
Popular algorithms: Principal Component Analysis (PCA), Singular Value Decomposition (SVD), Latent Dirichlet allocation (LDA), Latent Semantic Analysis (LSA, pLSA, GLSA), t-SNE (for visualization)
scikit-learn#
Scikit-learn is a library that allows you to do machine learning, that is, make predictions from data, in Python. There are four basic machine learning tasks:
Regression: predict a number from datapoints, given datapoints and corresponding numbers
Classification: predict a category from datapoints, given datapoints and corresponding numbers
Clustering: predict a category from datapoints, given only datapoints
Dimensionality reduction: make datapoints lower-dimensional so that we can visualize the data

Scikit-learn: theory#
Comprehensive library for machine learning
Computation pipeline is as follows:
Choose model
Select model’s hyper-parameters
Arrange data into feature matrix + target vector
Fit the model to data using the fit() method
Predict labels for unknown data
import pandas as pd
import numpy as np
import matplotlib.pyplot as plt
from sklearn import datasets
Regression#
diabetes = datasets.load_diabetes()
print(diabetes.DESCR)
df_diabetes = pd.DataFrame(diabetes.data,columns=diabetes.feature_names)
df_diabetes['target'] = pd.Series(diabetes.target)
df_diabetes.head()
df_diabetes['target'].plot(kind='hist')
df_diabetes.plot('bmi', 'target', kind='scatter')
X = diabetes.data[:,[2]]
Y = diabetes.target
X = df_diabetes[['bmi']].to_numpy()
y = df_diabetes['target'].to_numpy()
from sklearn import linear_model
model = linear_model.LinearRegression()
model.fit(X, Y)
print(model.coef_, model.intercept_)
print(model.score(X, Y))
model.predict(np.array([[0.05], [-0.02]]))
df_diabetes.plot('bmi', 'target', kind='scatter')

bmi = np.linspace(-0.1, 0.15, 20).reshape(-1, 1)
plt.plot(bmi, model.predict(bmi), 'r')
Classification#
Another example of a machine learning problem is classification. Here we will use a dataset of flower measurements from three different flower species of Iris (Iris setosa, Iris virginica, and Iris versicolor). We aim to predict the species of the flower. Because the species is not a numerical output, it is not a regression problem, but a classification problem.
from sklearn import datasets
iris = datasets.load_iris()
print(iris.DESCR)
X = iris.data[:, :2]
y = iris.target_names[iris.target]
for name in iris.target_names:
    plt.scatter(X[y == name, 0], X[y == name, 1], label=name)
plt.xlabel('Sepal length')
plt.ylabel('Sepal width')
plt.legend();
X = iris.data[:, 2:]
y = iris.target_names[iris.target]
for name in iris.target_names:
    plt.scatter(X[y == name, 0], X[y == name, 1], label=name)
plt.xlabel('Petal length')
plt.ylabel('Petal width')
plt.legend();
from sklearn.model_selection import train_test_split
X_train, X_test, y_train, y_test = train_test_split(X, y, test_size=0.2, random_state=0)
print(X_train.shape, y_train.shape)
print(X_test.shape, y_test.shape)
from sklearn.neighbors import KNeighborsClassifier
model = KNeighborsClassifier(5)
model.fit(X_train, y_train)
model.predict(X_test)
Evaluating your model#
np.mean(model.predict(X_test) == y_test) # Accuracy
import sklearn.metrics as metrics
metrics.accuracy_score(model.predict(X_test), y_test)
print(metrics.classification_report(model.predict(X_test), y_test))
# Cross validation
from sklearn.model_selection import cross_val_score
model = KNeighborsClassifier()
scores = cross_val_score(model, X, y, cv=5)
scores
print(f"Accuracy: {scores.mean()} (+/- {scores.std()})")
Clustering#
Clustering is useful if we don’t have a dataset labelled with the categories we want to predict, but we nevertheless expect there to be a certain number of categories. For example, suppose we have the previous dataset, but we are missing the labels. We can use a clustering algorithm like k-means to cluster the datapoints. Because we don’t have labels, clustering is what is called an unsupervised learning algorithm.
X = iris.data
for name in iris.target_names:
    plt.scatter(X[y == name, 0], X[y == name, 1], label=name)
plt.xlabel('Sepal length')
plt.ylabel('Sepal width')
plt.legend()
plt.show()
from sklearn.cluster import KMeans

model = KMeans(n_clusters=3, random_state=0)
model.fit(X)
model.labels_
iris.target
for name in [0,1,2]:
    plt.scatter(X[model.labels_ == name, 0], X[model.labels_ == name, 1], label=name)
plt.xlabel('Sepal length')
plt.ylabel('Sepal width')
plt.legend()
plt.show()
for name in iris.target_names:
    plt.scatter(X[y == name, 0], X[y == name, 1], label=name)
plt.xlabel('Sepal length')
plt.ylabel('Sepal width')
plt.legend()
plt.show()
Dimensionality reduction (PCA)#
Dimensionality reduction is another unsupervised learning problem (that is, it does not require labels). It aims to project datapoints into a lower dimensional space while preserving distances between datapoints.
Lets take a look at the breast cancer dataset with dimensionality reduction
bc = datasets.load_breast_cancer()
print(bc.DESCR)
X = bc.data
Y = bc.target_names[bc.target]
bc.feature_names
from sklearn.preprocessing import StandardScaler
X = StandardScaler().fit_transform(X) # normalizing the features
np.mean(X,axis=0),np.std(X,axis=0)
from sklearn.decomposition import PCA
pca_breast = PCA(n_components=2)
X_PCA = pca_breast.fit_transform(X)
pd.DataFrame(data = X_PCA, columns = ['pc_1', 'pc_2'])
for name in bc.target_names:
    plt.scatter(X_PCA[y == name, 0], X_PCA[y == name, 1], label=name)
plt.legend()
from sklearn.model_selection import train_test_split
from sklearn import tree
x_train,x_test,y_train,y_test=train_test_split(X_PCA,y,test_size=0.33,random_state=1)
clf = tree.DecisionTreeClassifier(max_depth=2)
clf = clf.fit(x_train,y_train)
print('accuracy:', clf.score(x_test,y_test))
tree.plot_tree(clf)
np.count_nonzero(y_train=='benign')